
Loading page
All-in-one HR platform · v2.0
14-day free trial · No credit cardhello@HrMagix.com
All-in-one HR platform · v2.0
14-day free trial · No credit cardhello@HrMagix.com
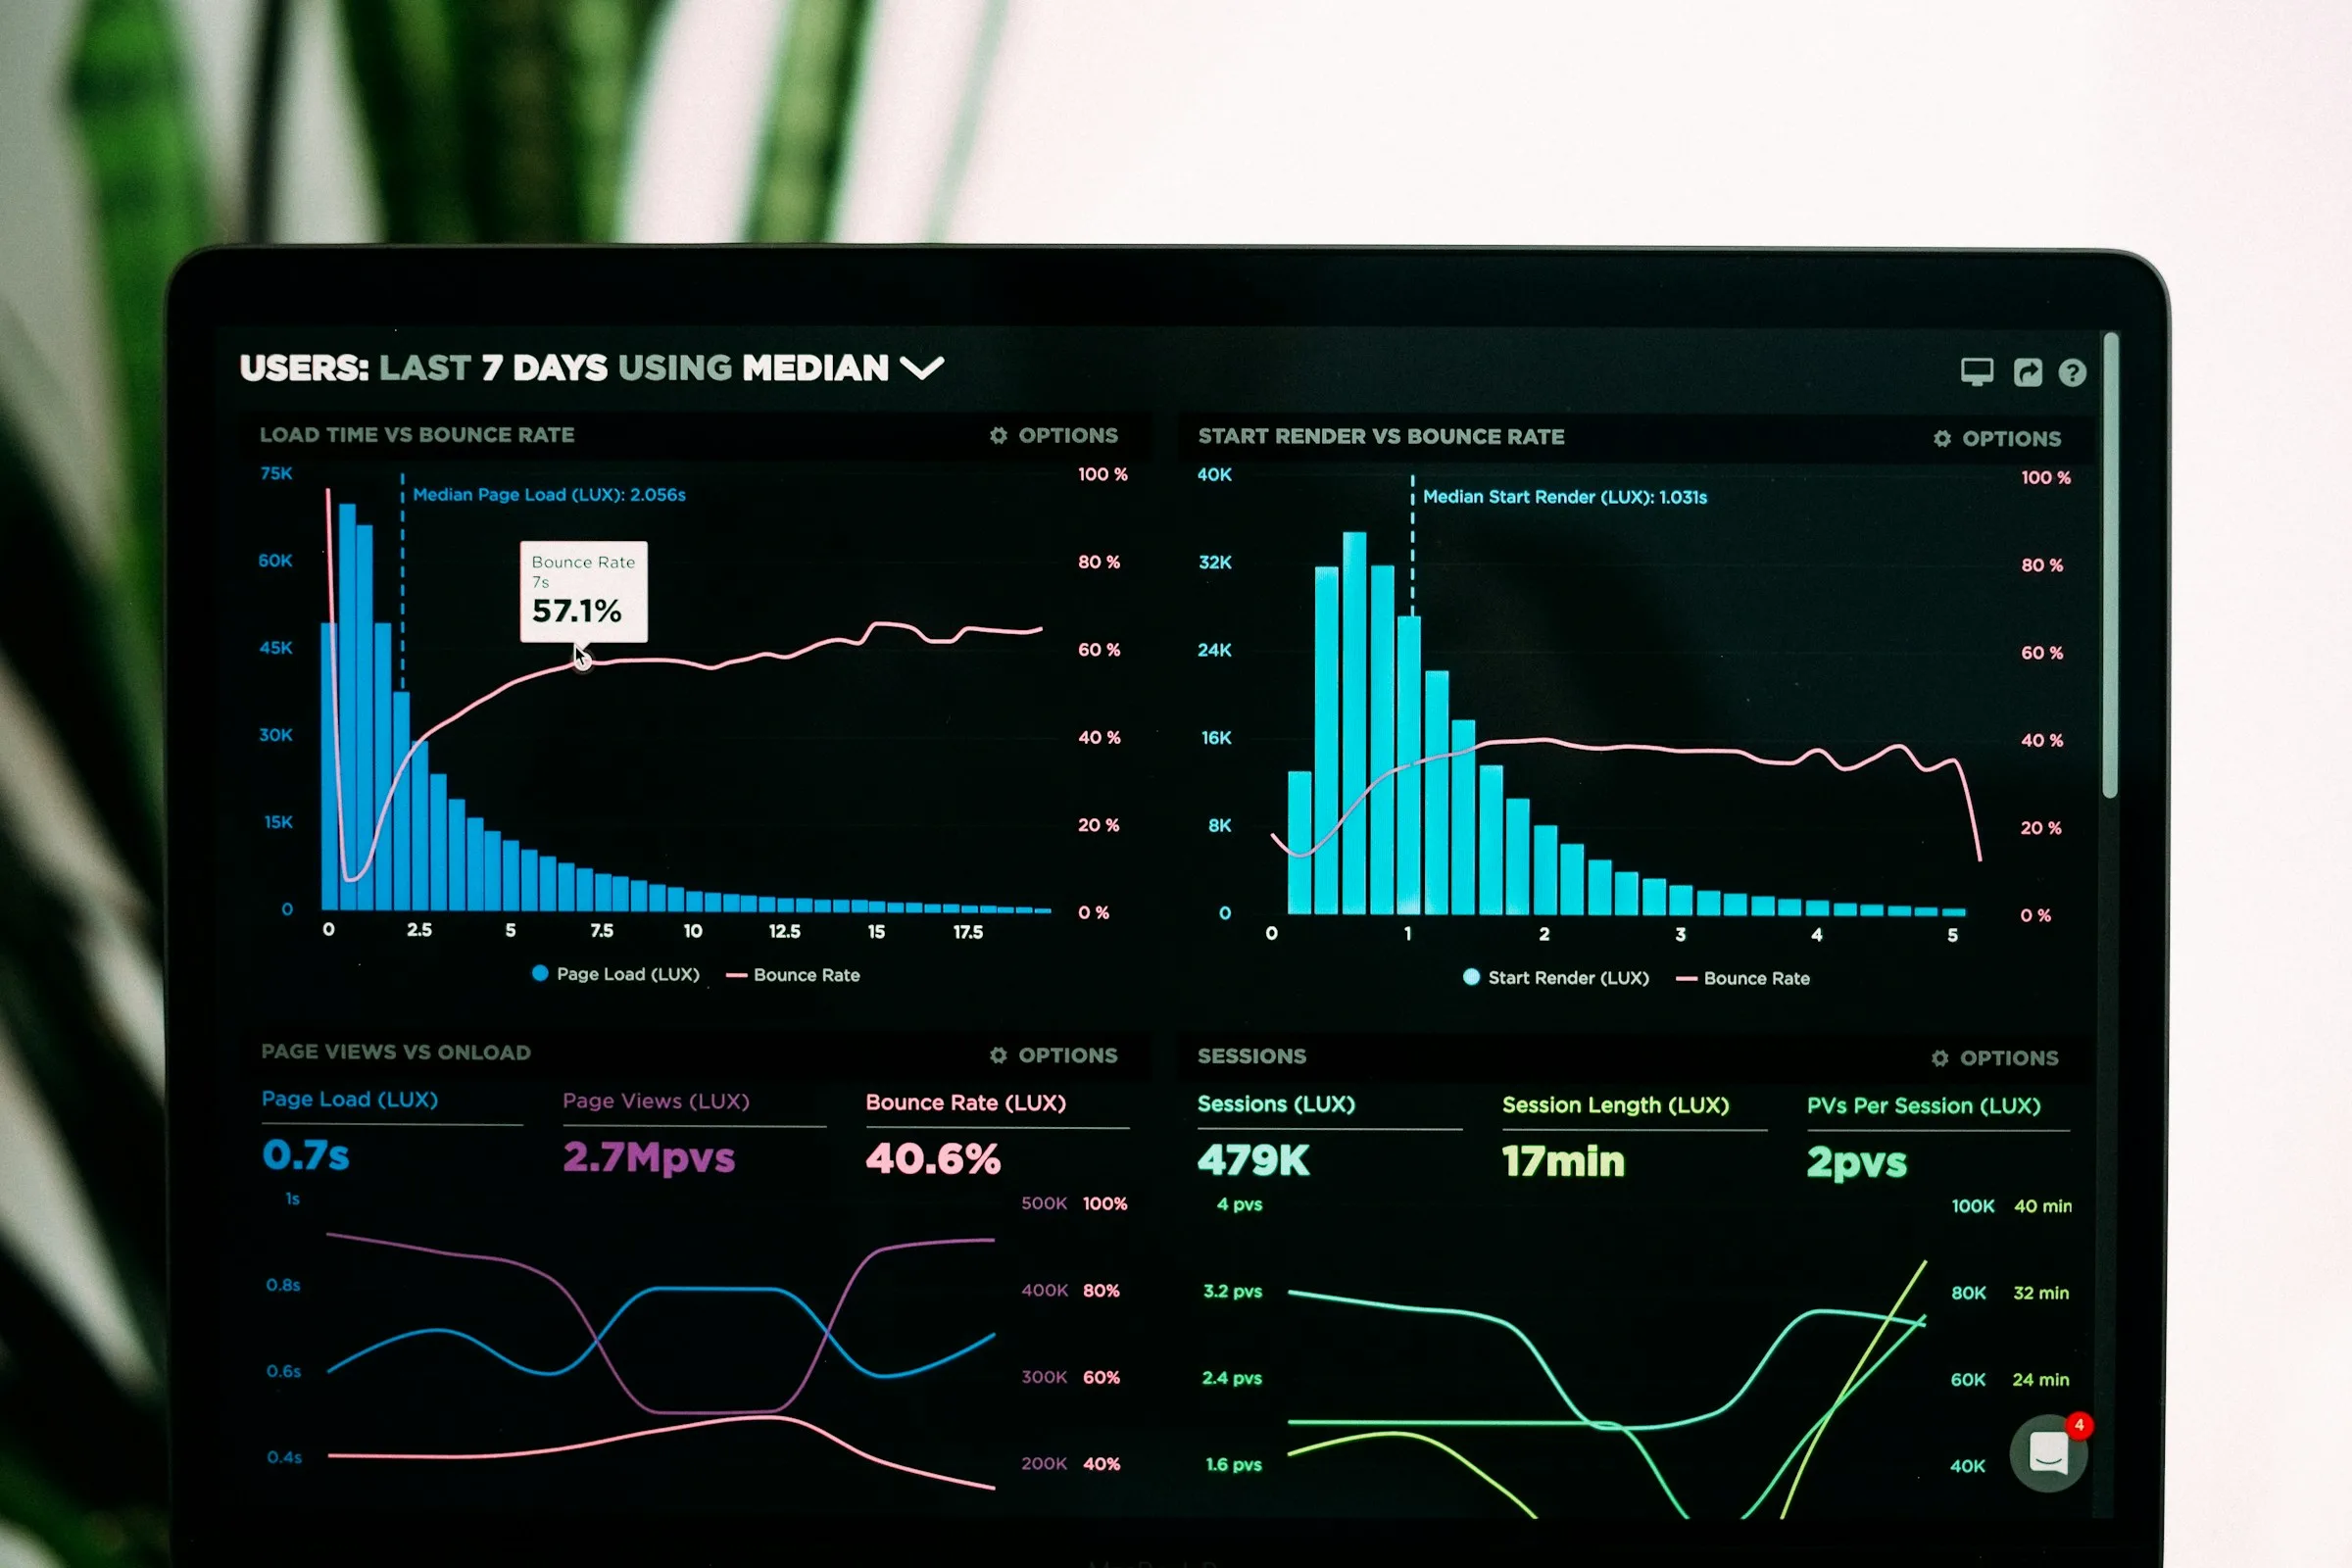
Because every module writes to one record, workforce reporting is a read rather than a project. Headcount, attrition risk, overtime cost, leave utilisation and payroll variance come from the data that is already there.
HR Analytics at a glance
Most HR reporting is not analysis. It is collation, pulling headcount from one place, resignations from another, overtime from a third, and reconciling the three before anyone can look at them. HR analytics software earns its place by removing that step rather than by drawing better charts.
By the time the numbers agree, the month they describe is over. The value of analytics in an integrated platform is not that the charts are better. It is that the collation step does not exist, so the question can be asked on a Tuesday and answered on a Tuesday.
Every figure below is a read on data another module already captured. Nothing here requires a separate collection exercise, which is the entire argument for reporting inside the platform.
Because every module writes to one record, workforce reporting is a read rather than a project. Headcount, attrition risk, overtime cost, leave utilisation and payroll variance come from the data that is already there.
Headcount growth, department distribution and gender diversity describe the shape of the workforce. Tenure analysis and early-warning attrition risk indicators describe its stability. Overtime expense, leave utilisation rates and payroll budget variance describe what it costs.
None of these are useful in isolation. Overtime rising in one department while attrition risk rises in the same department is a different story from either on its own, and that comparison is only possible because both come from the same record.
A CFO wants payroll cost by entity and its variance against budget. A plant head wants overtime by shift. A founder wants to know whether the attrition they are feeling is real or anecdotal. A compliance officer wants to know that this month's statutory filings reconcile to this month's payroll.
These are four different questions about the same underlying data, which is precisely why they are hard when the data lives in four systems and straightforward when it does not.
The usual approach to HR reporting software is to add a dashboard on top of whatever systems already exist and feed it by export. That works until two exports disagree, which they eventually do, because they were taken at different moments, or because a leave application was regularised after the first one ran.
Analytics inside an HR management system has no import step to go stale. The headcount on a chart is the count of active employee records at the instant you looked; the overtime figure is the sum of the same approved hours the payroll run will pay. A number can still be wrong, but it can only be wrong in one place, and correcting it corrects every view of it.
Workforce analytics tools are at their most useful when they are treated as a way of forming better questions rather than as a source of answers. A rise in leave utilisation in one team may be a burnout signal, or it may be that the team took a long-planned holiday together. The dashboard cannot tell you which; it can tell you where to look.
The indicators worth acting on are usually the ones that move together. Overtime climbing while attrition-risk indicators climb in the same department, over the same two months, is a pattern. Either one alone is noise. Reporting that draws both from the same employee record is what makes the comparison fair.
For that reason the platform reports what it can observe (hours, absences, tenure, cost and goal completion) and stops there. It does not score engagement from data it does not hold, or predict a resignation date.
Companies rarely stay one legal entity for long. A second office in another state brings a second professional tax registration; a subsidiary brings a separate PF code and its own payroll run.
Because entity and location are attributes of the employee record rather than separate installations, the same report can be read at group level or filtered to one entity without maintaining two versions of it. Statutory totals stay attached to the entity that owes them, which is the level at which they have to be filed.
A workforce number is only comparable if everyone agrees on its definition. These are the definitions the platform uses, stated so a figure can be checked rather than trusted.
Active employee records at the moment of reading, including those on approved leave. People serving notice are counted until their last working day.
Not the same as a payroll count during a notice period
Time from date of joining to today, or to the last working day for those who have left. Reported by grade, function and location, so distributions can be compared rather than averaged into one misleading number.
An early-warning flag assembled from signals the platform already holds: tenure, leave pattern, goal completion and time since the last review. It marks a record as worth a conversation. It is not a prediction.
A prompt to ask, not an answer
Approved leave taken as a proportion of the entitlement accrued so far in the leave year, by team. Reads low where balances are building toward carry-forward or encashment.
Approved overtime hours at the applicable rate, grouped by department and shift. Draws on the same approved hours the payroll run pays, so the two cannot diverge.
Actual payroll cost for the month against budget, by entity. Movement is attributable to its cause (joiners, exits, revisions, arrears or overtime), because each is a separate component of the run.
PF, ESI, professional tax and TDS totals by head for the period, at the entity level at which they are filed. These are the figures the returns are built from.
Four roles, four different questions, one underlying record. The value of HR reporting software is less in the charts than in nobody having to reconcile them first.
The feeling that people are leaving faster than they used to, with no way to tell whether that is true or whether three memorable exits are colouring the impression.
Headcount growth, tenure distribution and exits over time, read directly from the employee record. The answer is often that attrition is concentrated in one team or one tenure band, which is a different problem from a company-wide one, and a far more tractable one.
Payroll is the largest line in the budget and the hardest to forecast, because joiners, exits, increments and arrears all land in the same month and arrive as a single number.
Payroll cost by entity with variance against budget, broken into the components that moved it. Statutory contribution totals reconcile to the run that produced them, so the return and the ledger agree.
Being asked in a leadership meeting for figures that live in four places, and having a day to assemble something that holds up.
The collation step does not exist. Department distribution, leave utilisation, overtime and goal-completion trends are a read on data already captured, so the question can be asked and answered in the same meeting.
Overtime is rising on one shift, and it is unclear whether that is demand, understaffing, or a rota that has stopped working.
Overtime expense by department and shift, alongside the attendance records it was calculated from, so the hours can be traced back to the days and the people they came from.
Where every employee starts the day.
Asked by the people who have to defend a number in a meeting rather than produce it.
From the same employee record, attendance ledger and payroll runs the rest of the platform uses. There is no separate reporting database to load, which is why a figure in a report reconciles to the run it came from.
Analytics is part of the Growth plan alongside payroll, performance, OKRs and recognition. Starter covers attendance, leaves, the employee directory and documents.
They are read live. A report reflects the record as it stands when you open it, so a leave application approved an hour ago is already counted. There is no overnight refresh to wait for, and no cached figure to invalidate.
Yes. Entity, location, department and grade are attributes of the employee record rather than separate systems, so the same report can be read at group level or narrowed to one part of the organisation without maintaining a second version of it.
Signals the platform already holds: tenure, leave pattern, goal completion and time since the last review. It is an early-warning flag rather than a score: it tells you which records are worth a conversation, and does not claim to predict who will resign.
Yes. Reports export with the period and the filters they were run under recorded alongside them, which matters when a figure has to be defended later: an auditor's question is usually about what was included, not about the arithmetic.
Visibility follows the same role permissions as the rest of the platform. A department head sees their own department; salary components are visible only to roles that already have payroll access. Analytics does not create a side door into records the same user could not open directly.
Headcount is the number of active employee records at the moment of reading, including those on approved leave. People serving notice are counted until their last working day, which is why it can differ from a payroll count during a notice period.
Looking for a custom walkthrough or have specific statutory policy requirements? Connect with our product specialists in Pune for a 1-on-1 consultation.
A walkthrough against your own policies, with a dry-run before the first live cutoff.
14-day free trial · Full access to all 12 modules · Zero implementation fee · Cancel anytime